↓ ↑

Counting is no longer subjective.
Welcome to DreamChart.

The web's most market-adapted analysis tools - with objective event detection, auto-counting, and structural trend timing - for Forex, Stock, and Crypto analysts, traders, and investors.


Dreamchart has the ability to search for trend pivots in a cloud-based monitor using a number of proprietary methods. You choose the market, timeframe, and starting point, DC monitors that trend server-side and sends you Telegram alerts when possible pivot points occur. Each pricing teir below comes with its own monitor allowance - which determines how many trends you can track.

$99 monthly (10 monitors), $354 every 6 months ($59/mo, 20 monitors), or $588 annually ($49/mo, 30 monitors). Cancel anytime.

Three things you won't find on any other platform

Exclusive — Auto Trendlines

One click. The one line price actually respects.

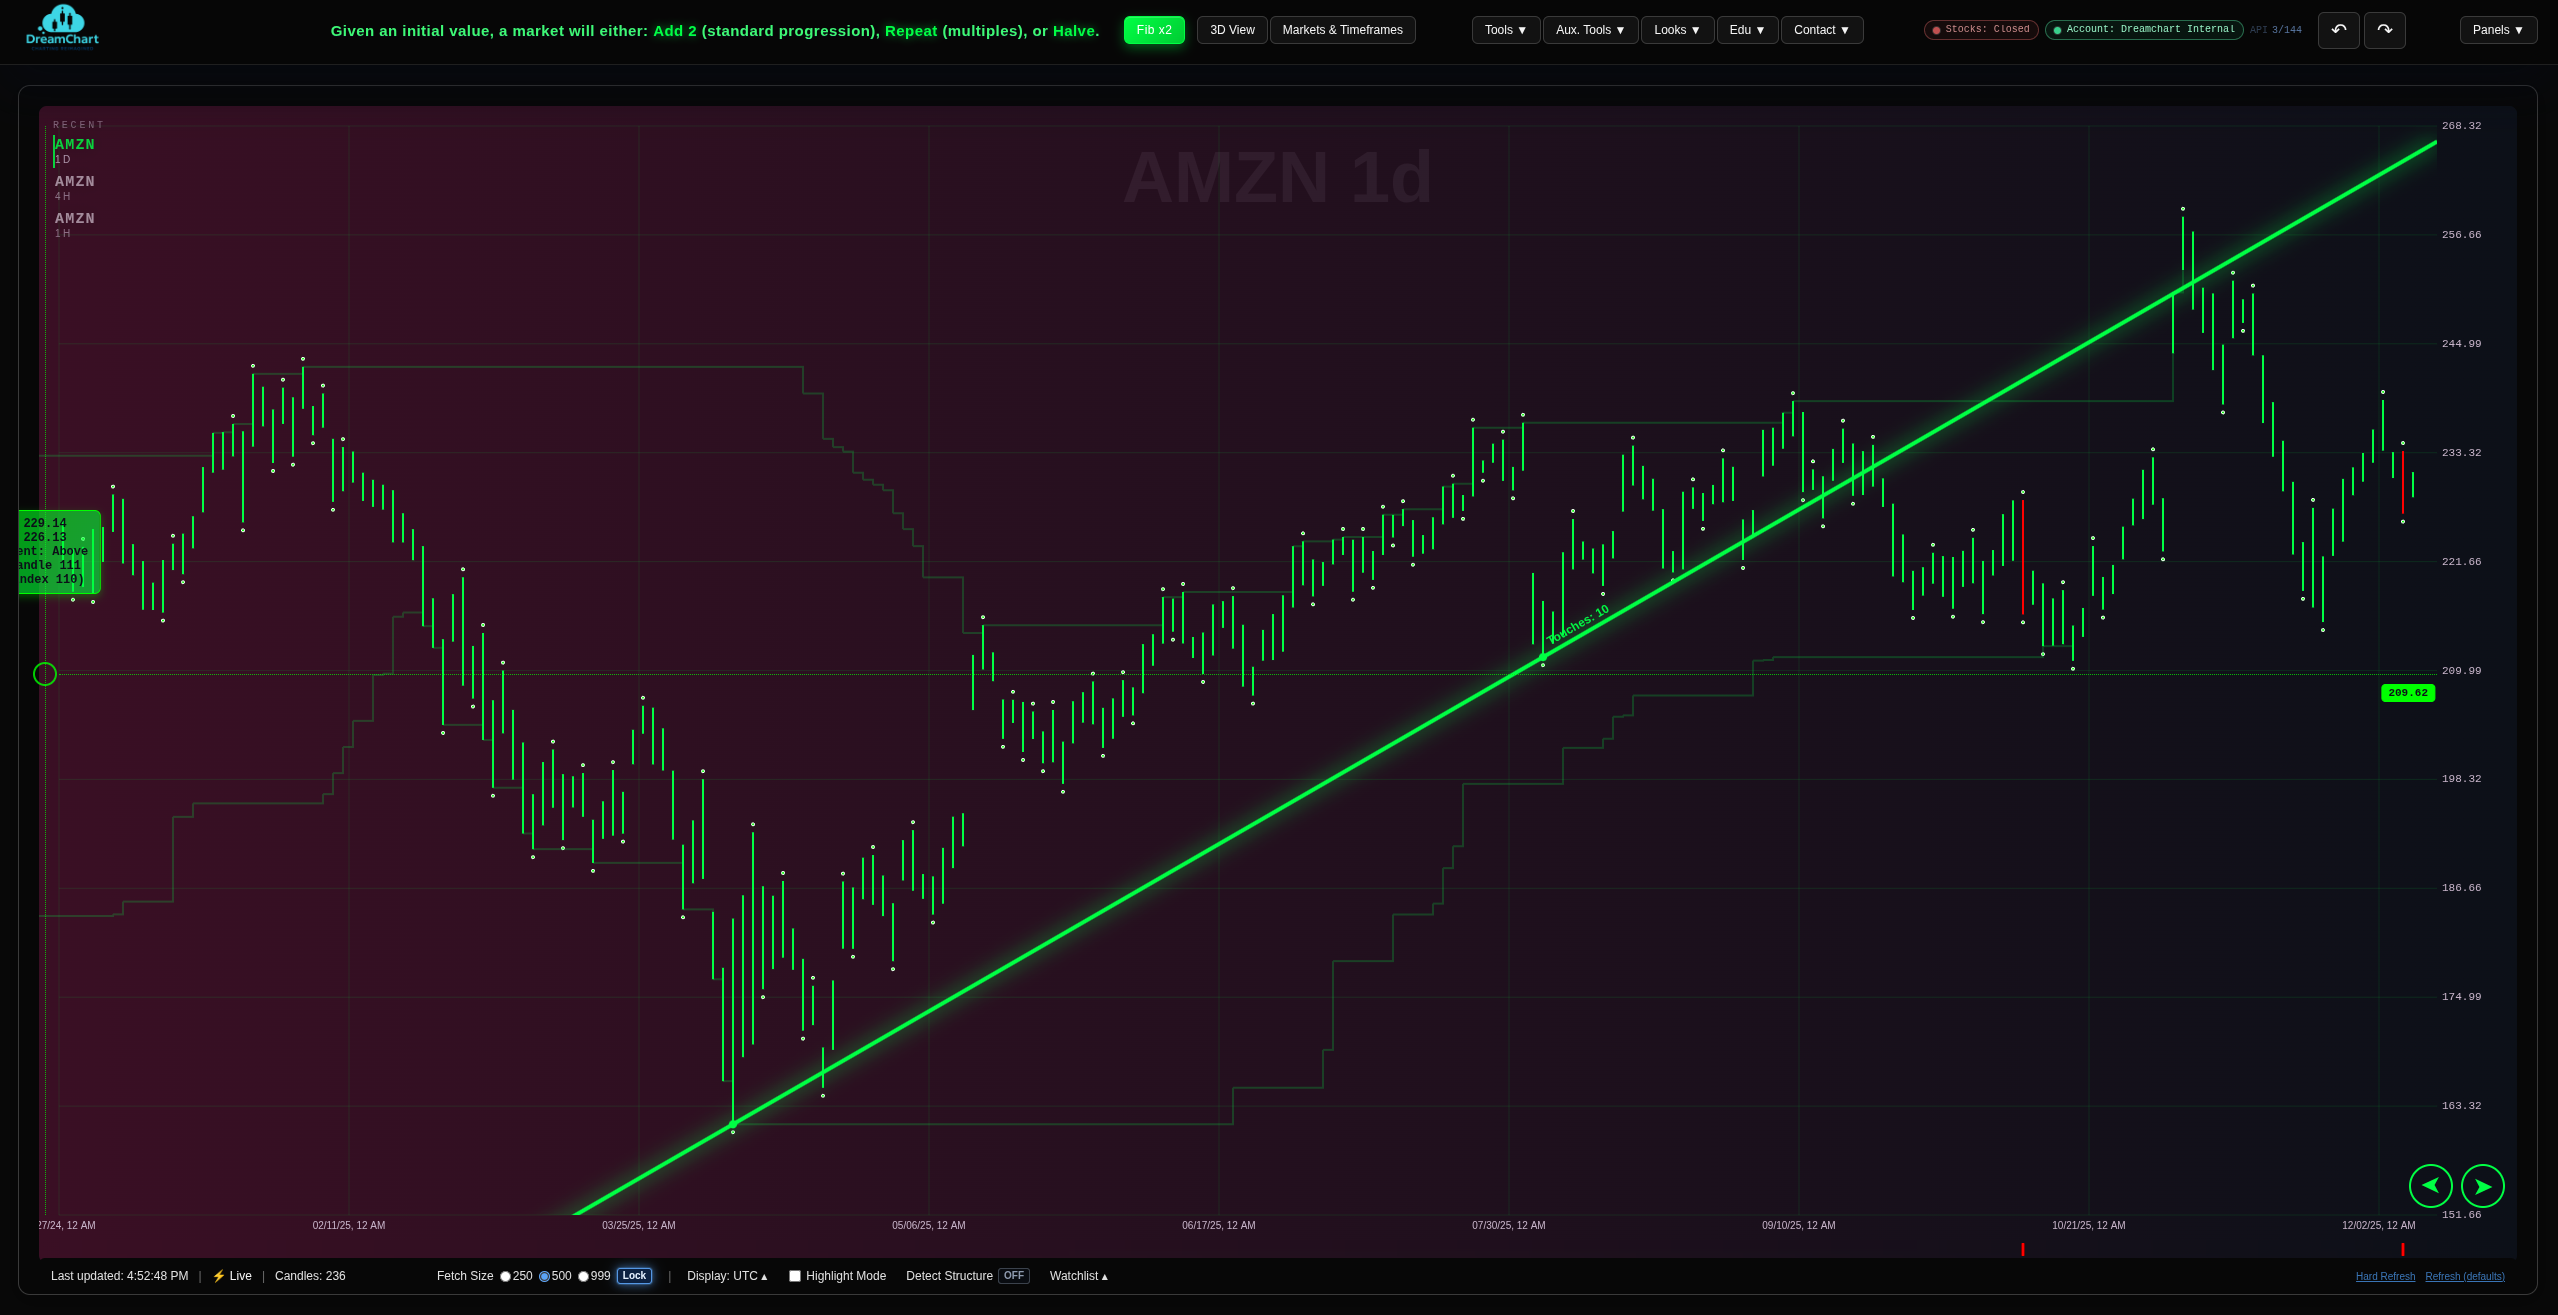
Other platforms make you eyeball trendlines — or auto-fit them with statistics that ignore market structure entirely. DreamChart draws yours instantly, and anchors it only to valid structural pivots. Every candidate anchor competes head-to-head, and the anchor producing the most price touches wins — giving you the one line that hyper-interacts with price, chosen by structure instead of guesswork.

Flip on the Channel overlay and a parallel rail is projected through the most extreme opposing structural terminal — a channel whose far wall is real structure, not a statistical band.
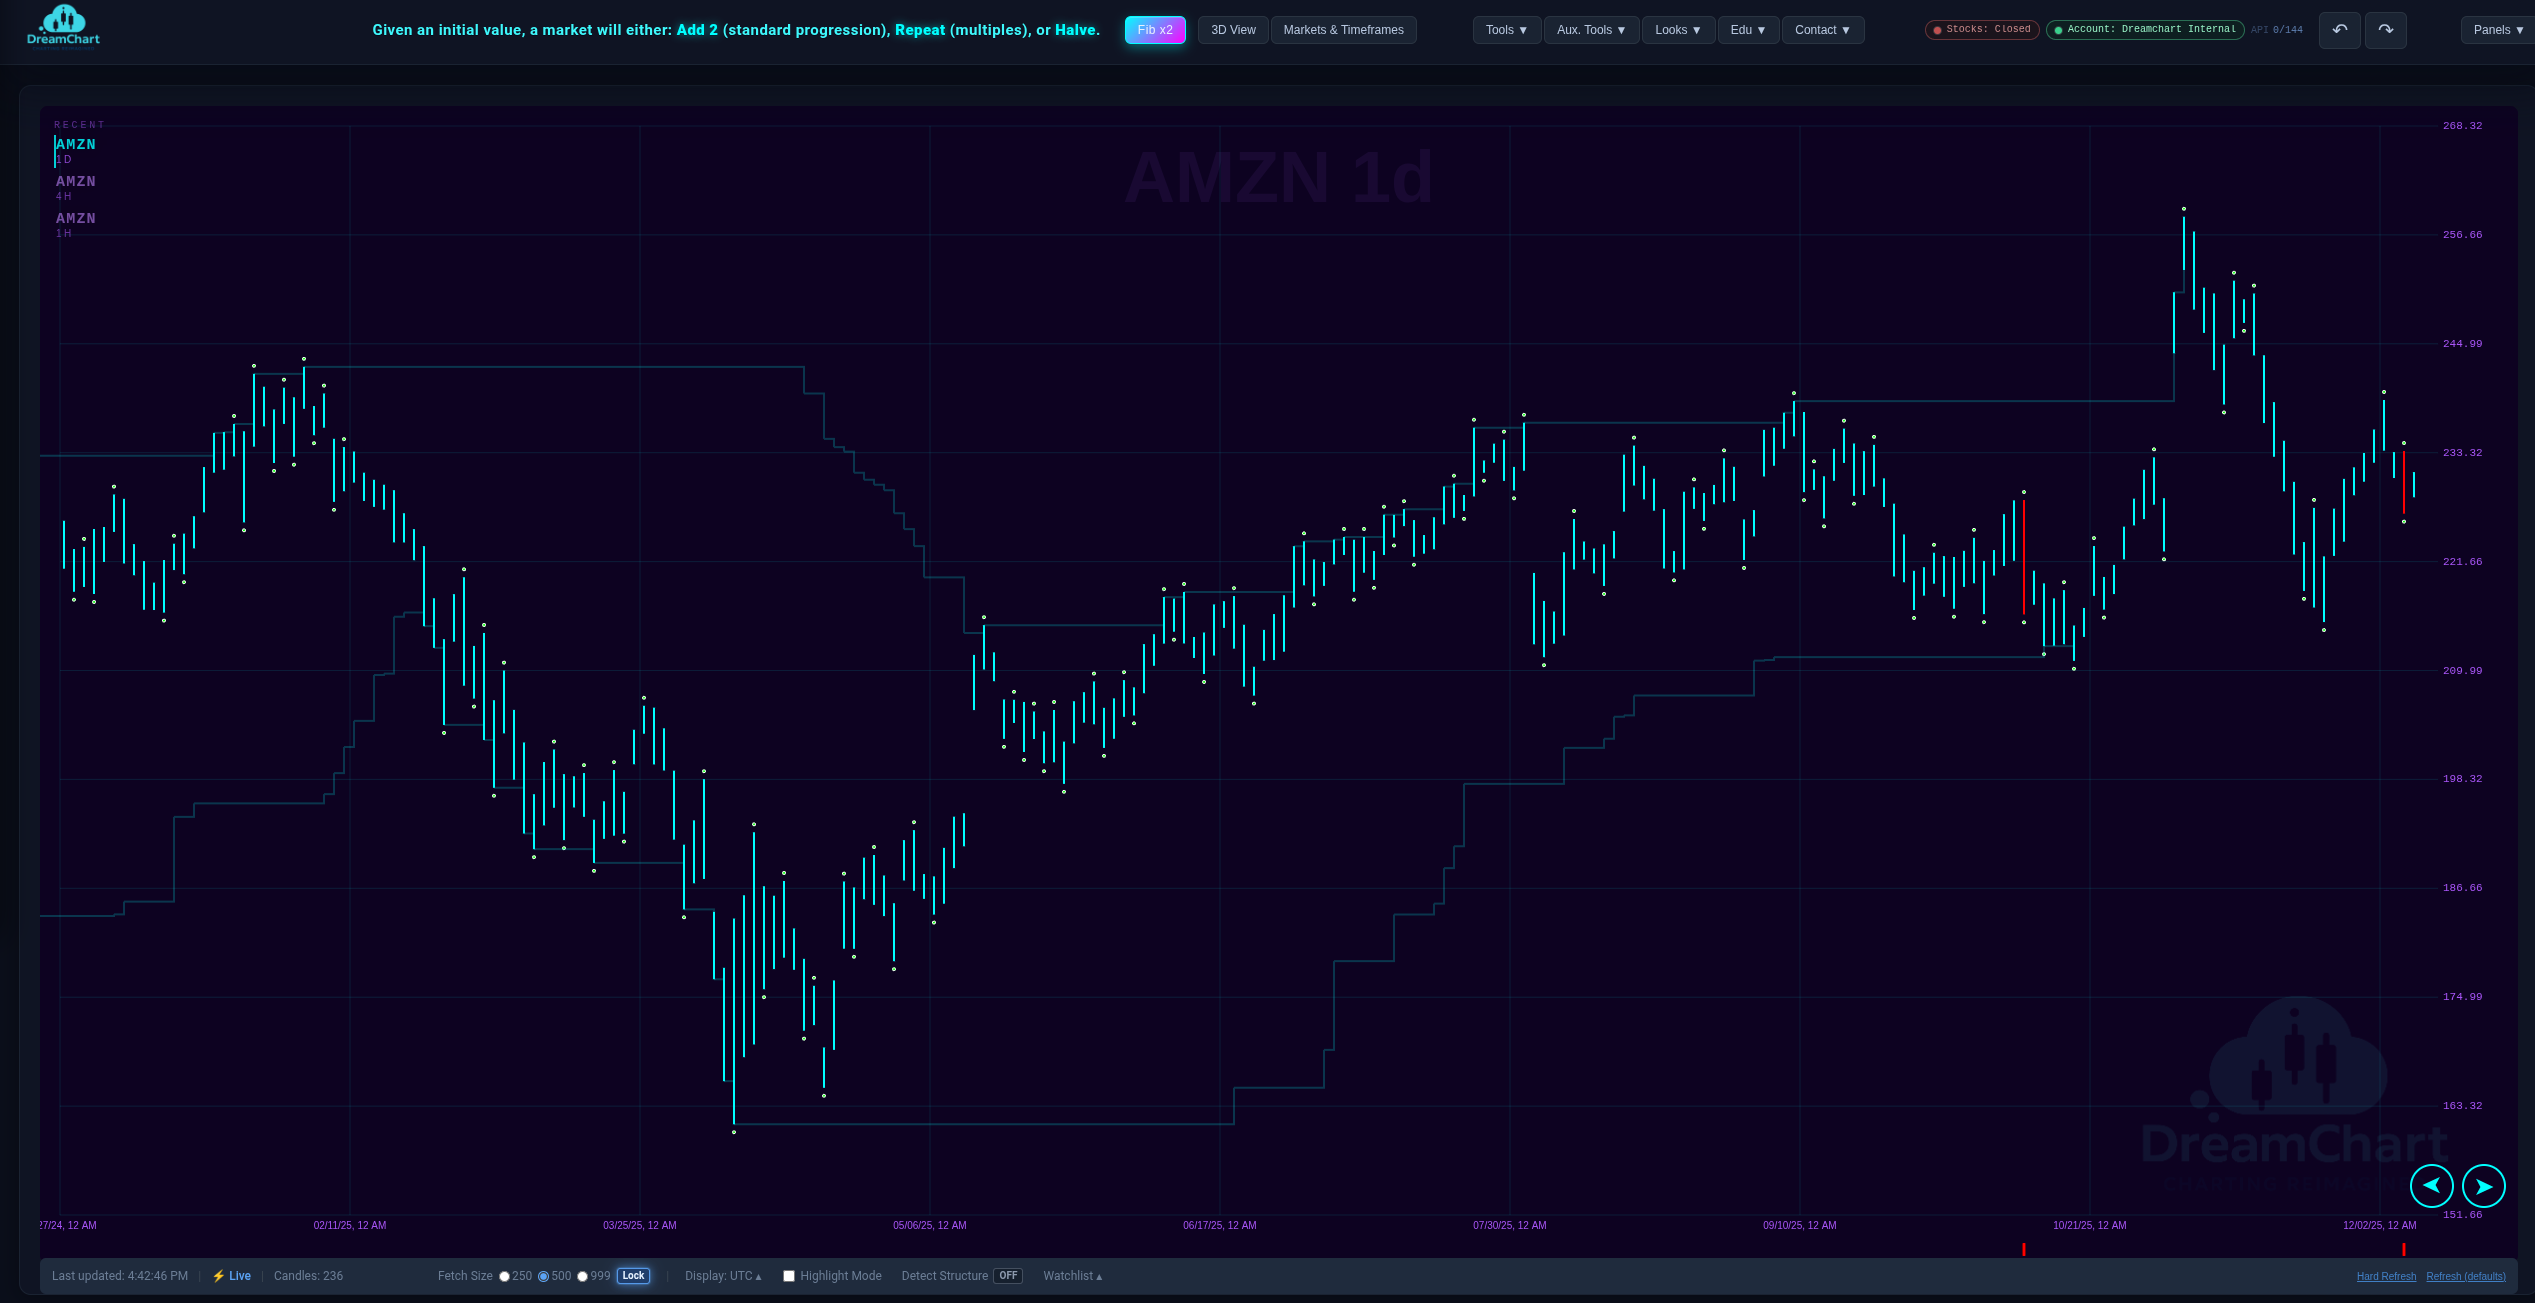
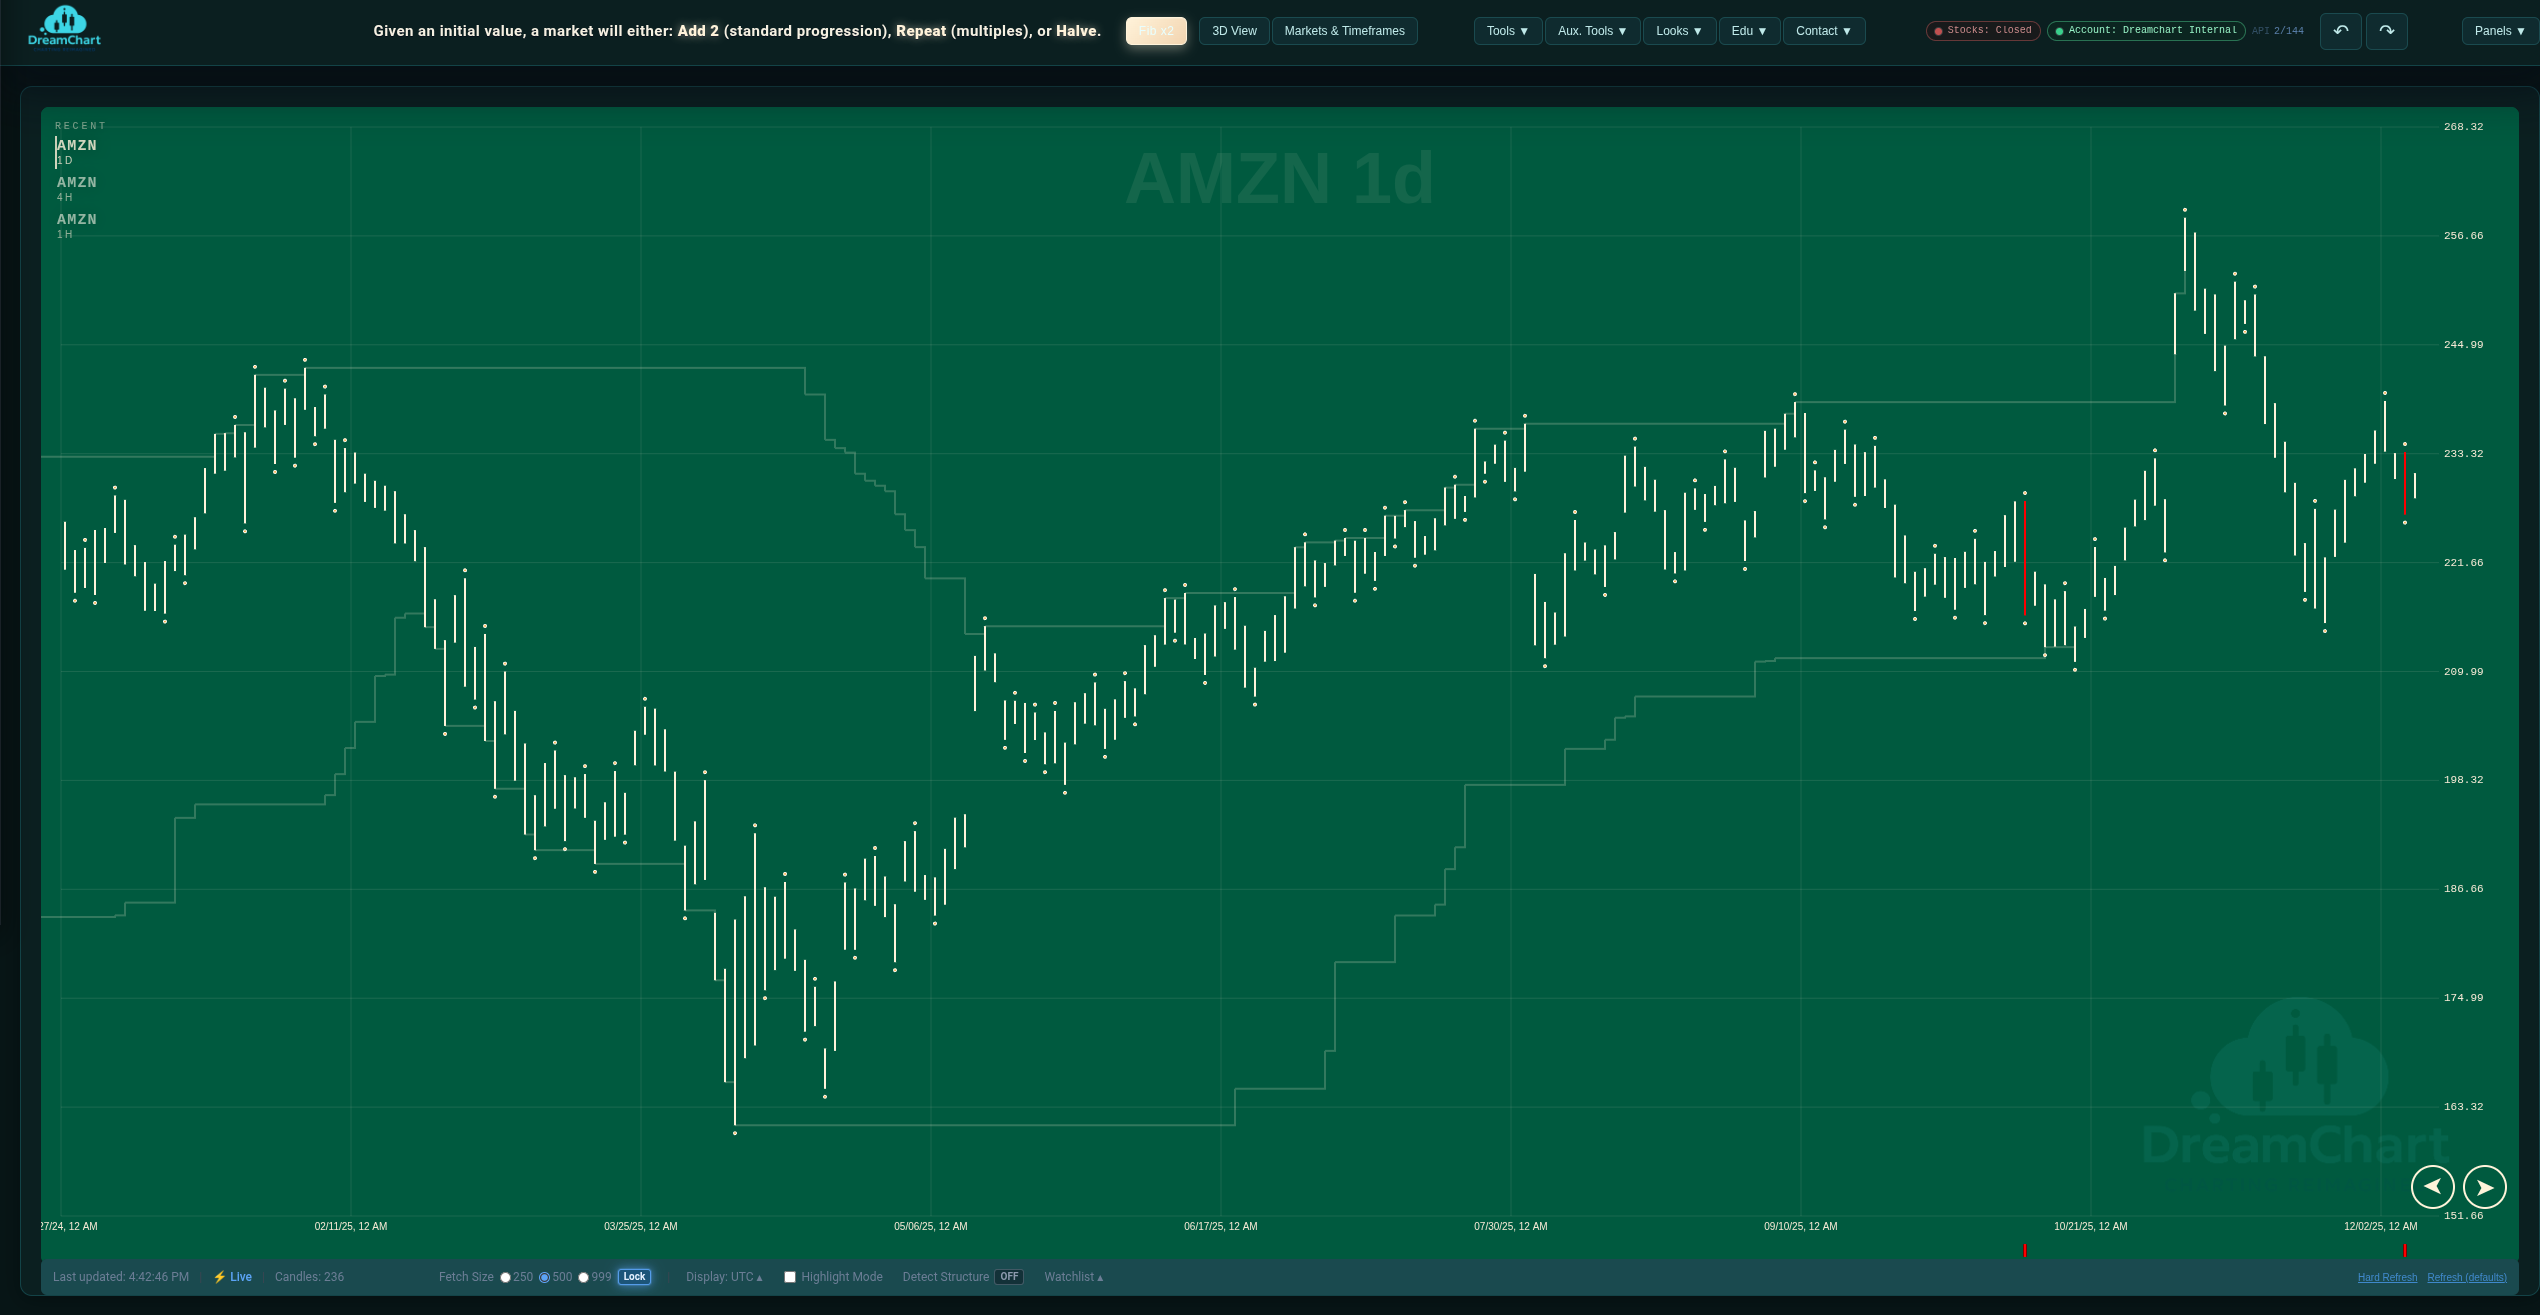
The auto trendline snapping to its highest-touch structural anchor, live.
Exclusive — Structure Detection

A Platform that can crawl the trend, and understand structure for you.

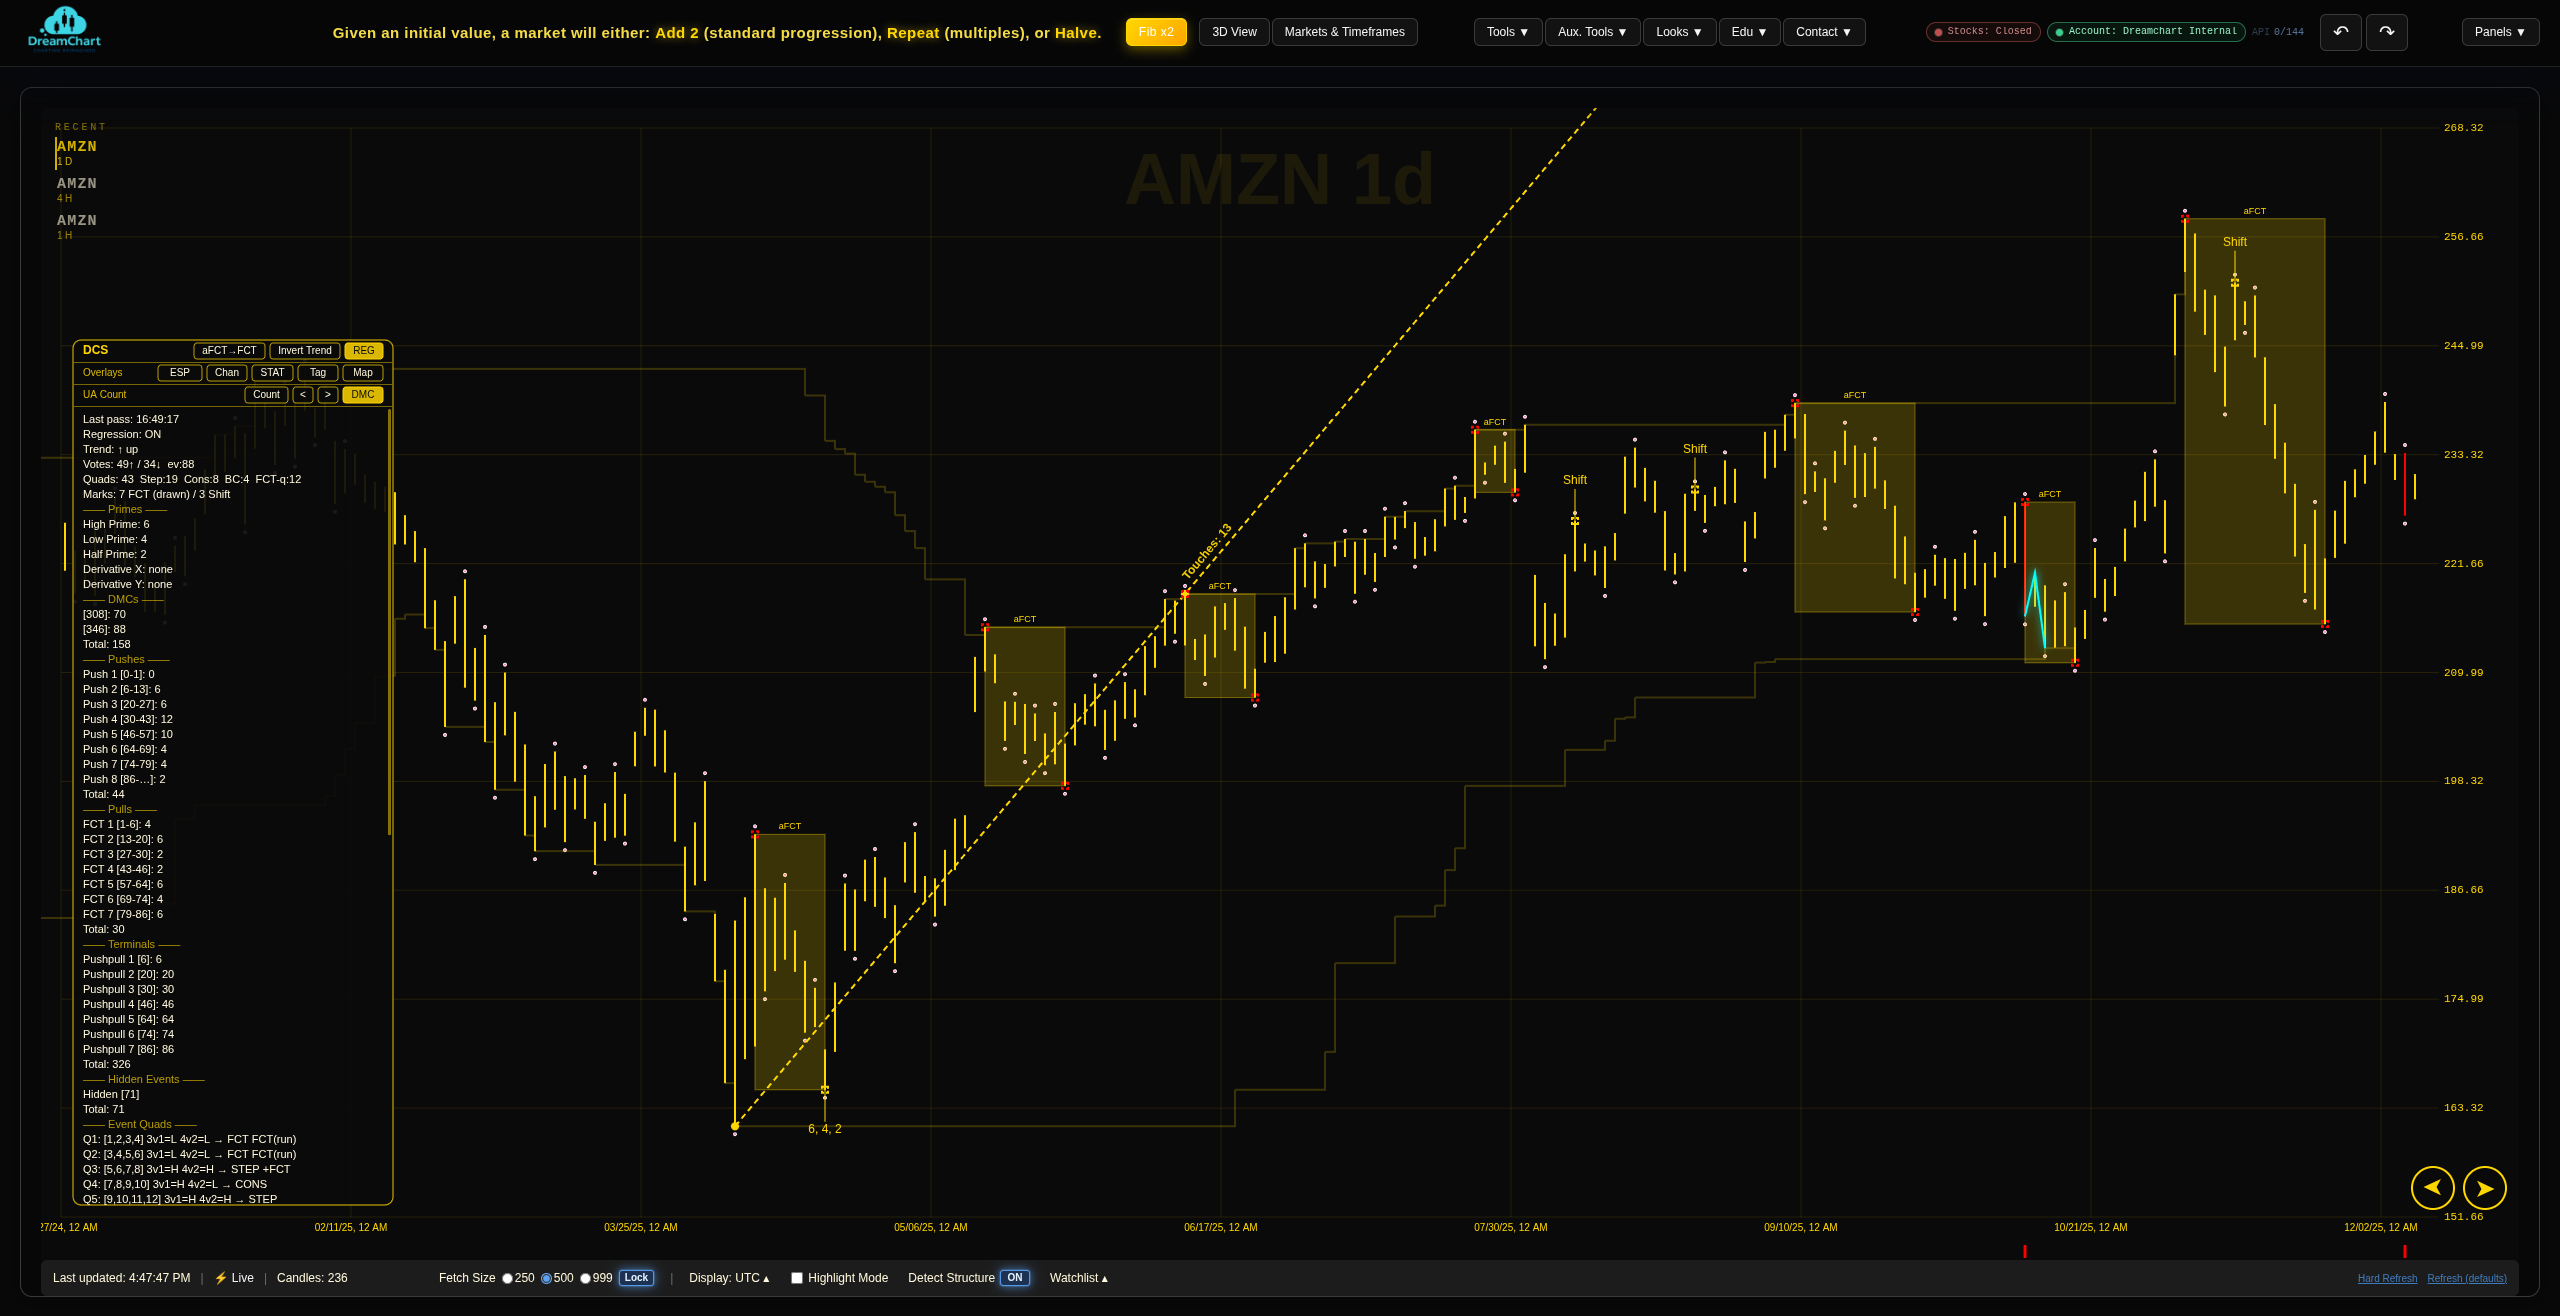
Detect Structure analyzes everything from your chosen start to the right edge of the chart in a single pass: trend direction by structural vote, auto-detected FCTs, shift tags, a full event count, and auto trendline — all placed for you, all automatically.

The video here shows what that crawl looks like.

A full DCS pass: auto FCTs, counts, trendline, and live endpoint projection.
Exclusive — Self-Healing Charts

Your chart audits its own data — then repairs it.

Bad data quietly ruins good analysis, and most platforms never tell you it happened. DreamChart's Integrity Core audits your chart on every refresh, tab focus, and candle close — then cross-checks recent bars against independent consensus data. When the two disagree, your feed is the suspect, not your analysis.

Bars your provider dropped or corrupted are detected, rebuilt from a second source, merged back into the chart, and stored server-side — so every device you use, including mobile, gets the repaired feed. An audit log records every check and every repair. Your chart heals itself.

See it in motion

Orbit and Fly-through in an interactive 3D environment.
Your workspace. Your atmosphere.

DreamChart Themes

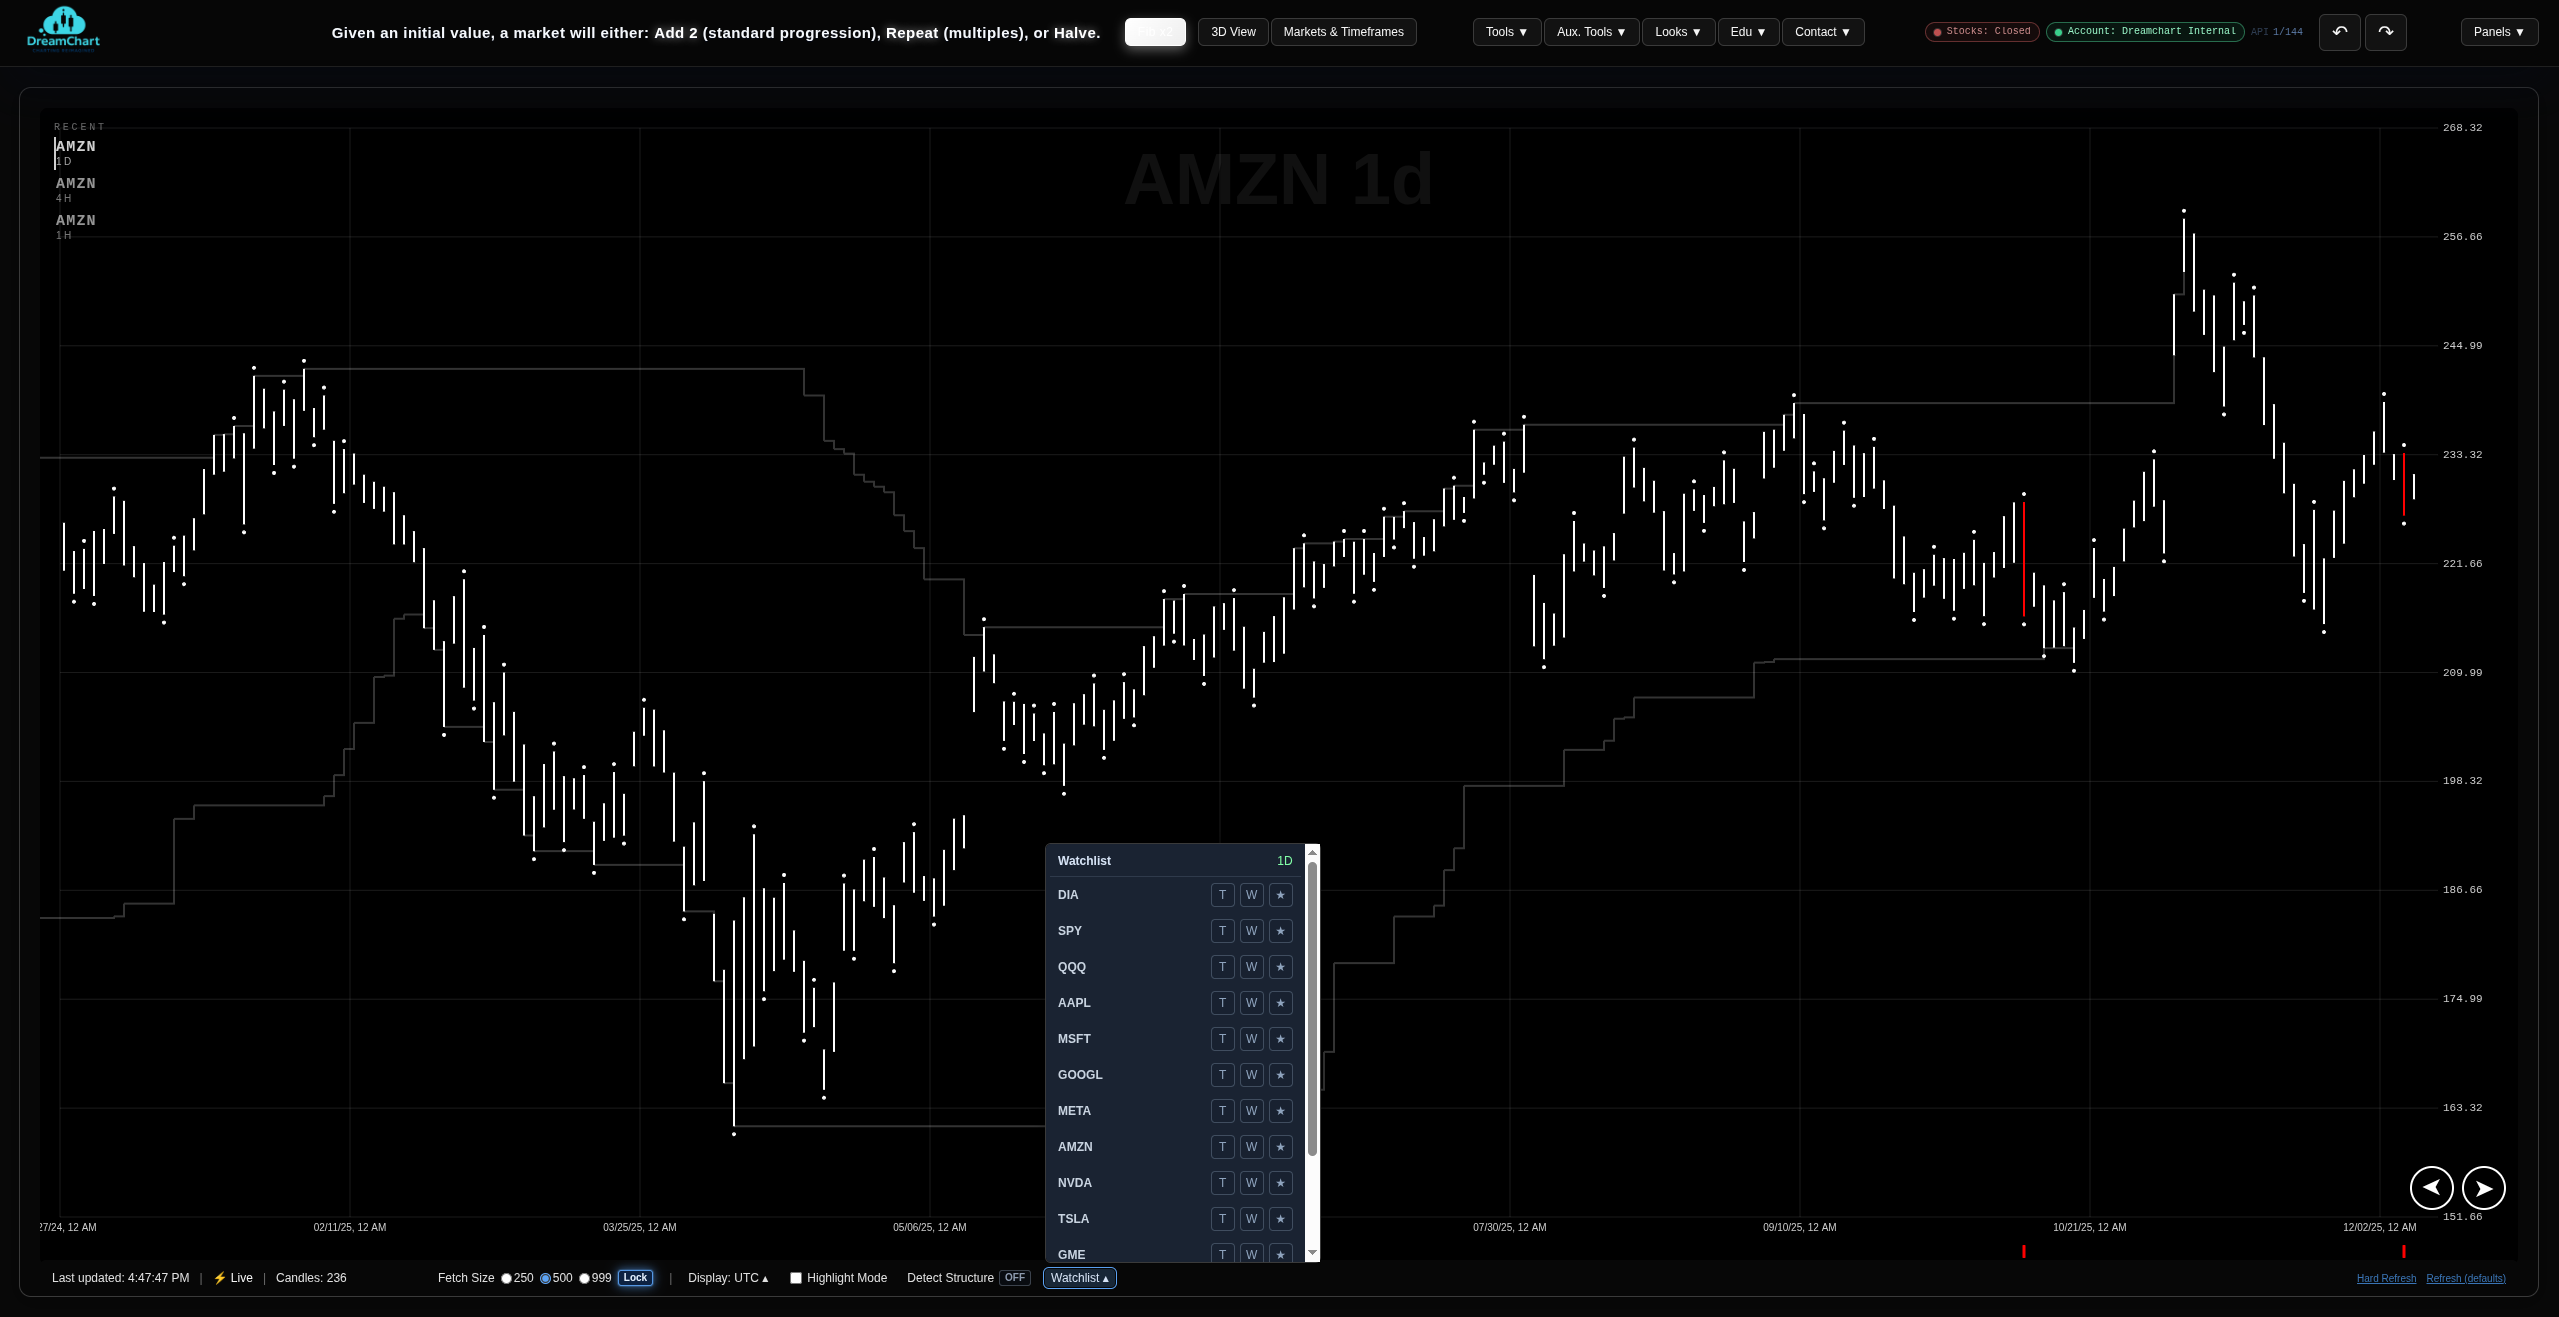
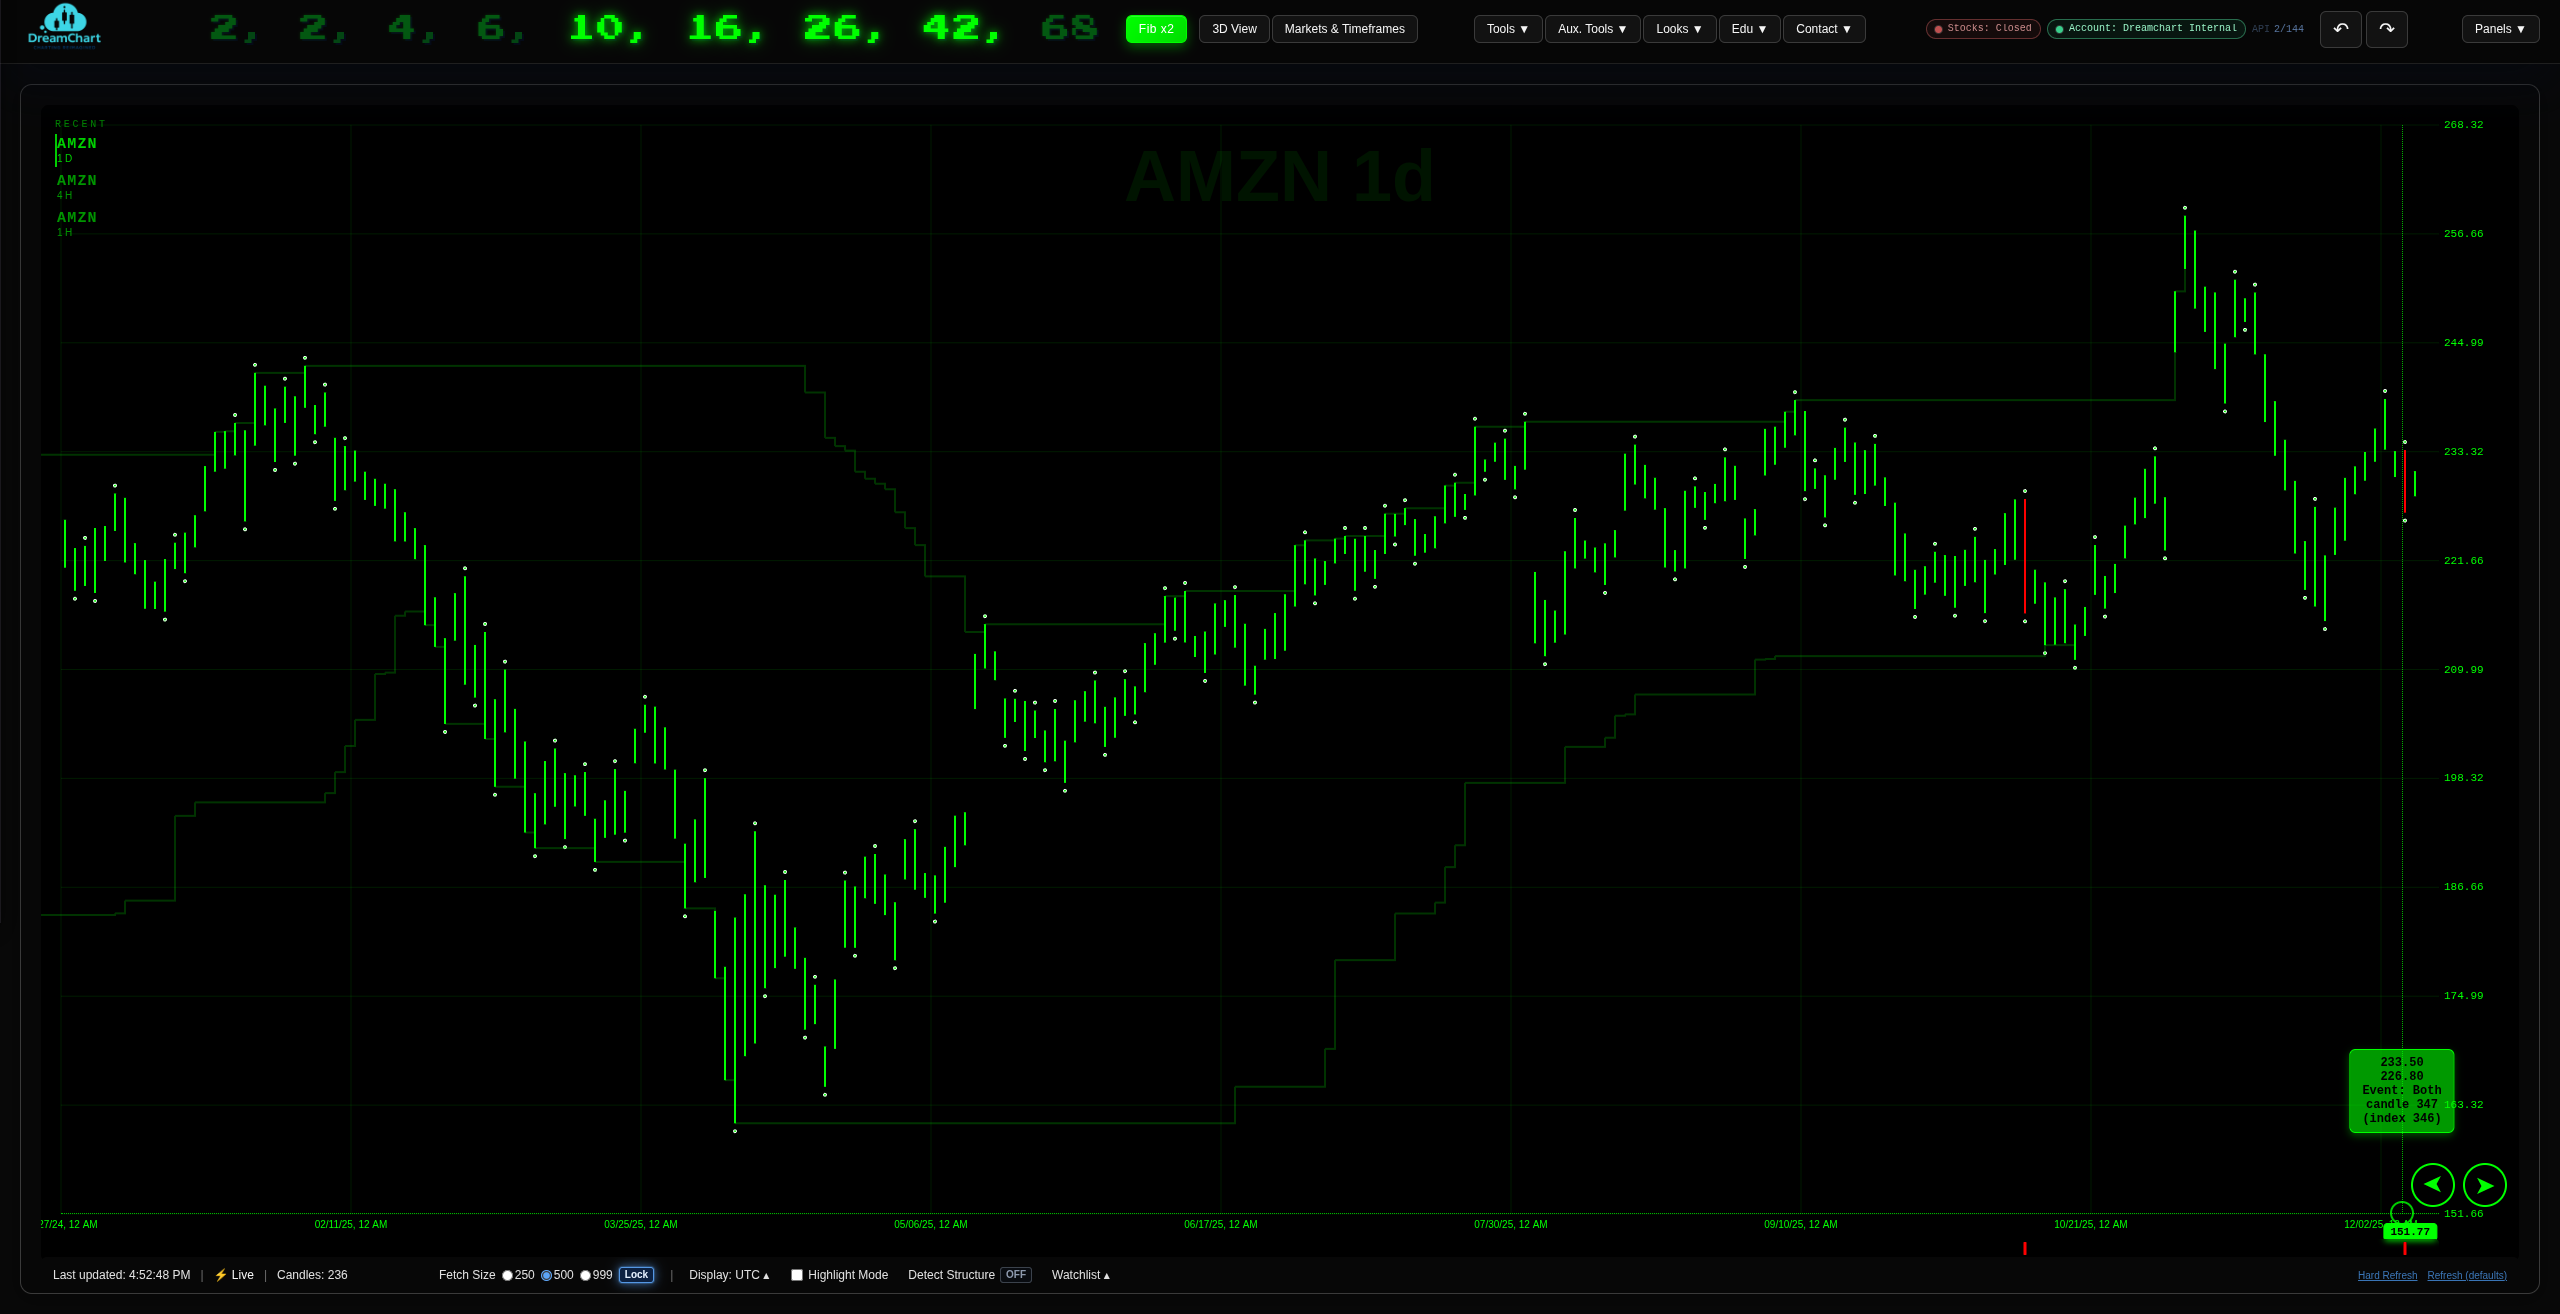
A sample of the many chart themes available to match your mood.

DreamChart theme 1 chart workspace preview
DreamChart theme 2 chart workspace preview
DreamChart theme 3 chart workspace preview
DreamChart theme 4 chart workspace preview
DreamChart theme 5 chart workspace preview
DreamChart theme 6 chart workspace preview

Secure Checkout

Complete your DreamChart subscription securely through Stripe.

6-month billing saves $480 per year versus monthly.

Loading secure checkout...